")
")
| "The National Report of the Russian Federation on the Inventory of the Anthropogenic Emissions and Sinks of Greenhouse Gases Not Controlled by the Montreal Protocol for the years 1990-2010” |
 |
 |
 |
|
(Prepared by Scientific Development and Climate Programs Unit, Roshydromet,with the participation of the Deputy Director of the Institute of Global Climate and Ecology of Roshydromet and RAS, an expert of the Russian delegation at the talks on preventing climate change, A.I. Nahutin)
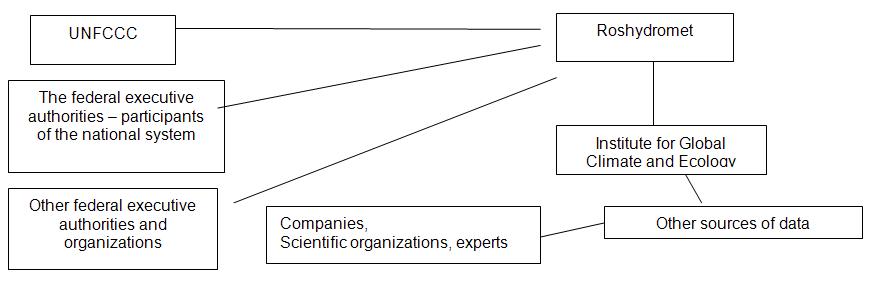
In March 2012 another annual "National Inventory Report” for the years 1990-2010 was completed. The "National Inventory Report" was prepared by Roshydromet (a national authority in the assessment of anthropogenic greenhouse gases emissions and sinks), with the participation of relevant federal executive authorities and organizations. The methodological centre for preparing the "National Inventory Report" is the Institute of Global Climate and Ecology of Roshydromet and RAS (IGCE). The report, together with the electronic inventory data tables and the data tables of the national registry of carbon units, is available on the site of the UN Framework Convention on Climate Change:
In accordance with its obligations as a Member State to the UNFCCC included in Annex I, which includes developed countries and countries with transition economies, Russia annually submits to the UNFCCC Secretariat a detailed report containing data on greenhouse gases anthropogenic sources and sinks, written in accordance with the detailed requirements of the Intergovernmental Panel on Climate Change (IPCC) and divided into the sectors: "Energy", "Industrial Processes", "Solvent and Other Product Use", "Agriculture", "Waste" and "Land Use, Land-Use Change, and Forestry" (LULUCF). The organization of greenhouse gases inventory in the Russian Federation.
In accordance with Article 12, paragraph 1a of UNFCCC, the National Inventory includes information on the following greenhouse gases: carbon dioxide (CO 2), methane (CH4), nitrous oxide (N2O), hydrofluorocarbons (HFCs), perfluorocarbons (PFCs) and sulfur hexafluoride (SF6). In accordance with the obligations applicable to the Parties included in Annex I to the UNFCCC, the National inventory also includes information on the following indirect greenhouse gases: carbon monoxide (CO), nitrogen oxides (NOX), non-methane volatile organic compounds (NMVOCs) and sulfur dioxide (SO2).
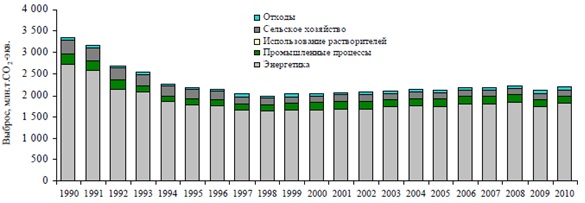
The change in the total emissions of the Russian Federation in 1990-2010. From 1990 to 1998 there was a decline in emissions, affecting all the sectors, and related to the overall dynamics of the economic situation in the country (Figure 1). In the subsequent years, the period of the economy growth, there was a steady increase in emissions. In 2010, the total greenhouse gas emissions were 10.7% higher than the emissions in 1998, but remained 34.3% below the 1990 emissions. Unlike in previous years, in 2010 the change in emissions was multidirectional: in one case they increased (the sectors "Energy", "Industrial Processes" and "Solvent and Other Product Use"), in the other sectors - " Agriculture ", “LULUCF” and " Waste " - they decreased. The highest emissions growth was recorded in the sector "Industrial processes" and comprised 9.4% from the emissions level in 2009, the largest decrease in emissions was recorded in the sector "Agriculture" (3.9% of the emissions level in 2009). The distribution of emissions levels by sector for the years 1990-2010 did not change significantly. In absolute magnitude, the emissions of the energy sector are still dominating (in 1990 and 2010 their share amounted to 81.1% and 82.6% respectively). The share of the agricultural sector, which, unlike other sectors, saw no growth of emissions in 1998-2010, was reduced (9.5% and 6.2% in 1990 and 2010). In contrast to other sectors, the emissions associated with waste exceeded the level of the base year, reaching in 2009 the value of 123.9% of the emissions in 1990. The total greenhouse gas emissions in the Russian Federation, excluding land use, land-use change and forestry in 2010 was 2 million tons 201.89 CO2-eq. (which is 65.7% in comparison to 1990). The growth rate of total emissions in 1999 - 2008 lagged behind the GDP growth rate, which is connected both with an increase in the overall energy efficiency of the economy, and with the structural economic changes of that period, in particular, with the growth of the non-manufacturing sector share in the economy of the Russian Federation.
Fig. 1. Greenhouse gas emissions in the Russian Federation excluding land, land-use change and forestry
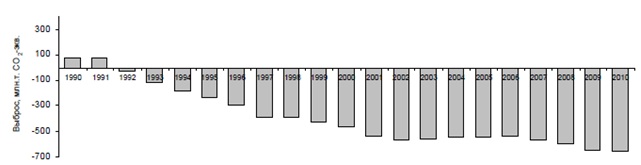
The emissions dynamics in land use, land-use change and forestry is characterized by a distinct upward tendency in sinks and a downward one in emissions in 1990-2010. Its causes are related to:
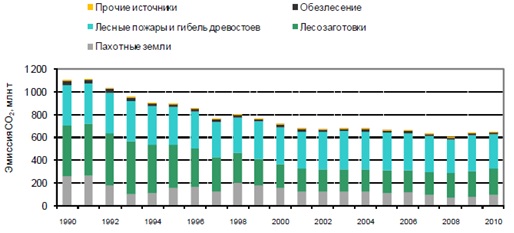
Figure 2 shows the resulting trend in greenhouse gas emissions from "Land Use, Land-Use Change and Forestry", consisting of emissions from arable land, organic soils, forest fires, peat mining and also from the activity of forests deforestation as well as the absorption of carbon dioxide by biomass and other carbon pools of managed forests, feed lands and lands converted from arable to feed. In the Figure, emissions have a positive sign, and sinks (absorption) - negative. In 2010, the sinks in this sector, compensated 29.6% of the total greenhouse gas emissions in other sectors.
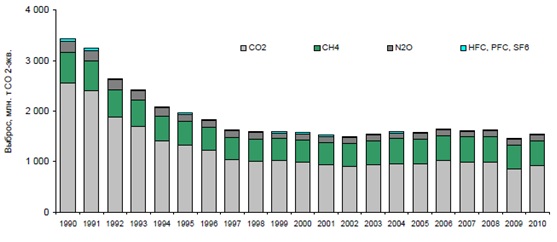
Fig. 2. The dynamics of anthropogenic greenhouse gases emissions and sinks from "Land use, Land-Use Change and Forestry" The tendencies in emissions of different gases The share of an individual greenhouse gas in their total output is shown in Figure 3. As can be seen from the Figure, the leading role belongs to CO2, the source of which is mainly the energy sector - burning fossil fuels, and also land use, land-use change and forestry. The second place is held by CH4 (the main sources are oil and gas industries and coal mining, classified by the IPCC as belonging to the energy sector, as well as stock-raising). A reduction in the proportion of total N2O emissions, in this period, occurred mainly due to the decrease in the use of nitrogen fertilizers in agriculture. The contribution of hydrofluorocarbons, perfluorocarbons and sulfur hexafluoride in the total greenhouse gas emissions tends to increase, but overall is not great.
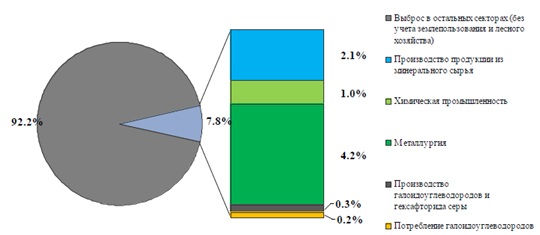
Fig. 3. The contribution of individual greenhouse gases to the total anthropogenic emissions of the Russian Federation, without accounting for land use, land-use change and forestry 1. Energy The sector "Energy" makes the greatest contribution to the total anthropogenic greenhouse gas emissions in Russia. In 1990, the sector's contribution to the total anthropogenic greenhouse gas emissions (excluding the sector "Land Use, Land-Use Change and Forestry"), was 81.1% in CO2-equivalent, while in 2010 it amounted to 82.6%. The main emissions are connected with burning fossil fuels extracted in Russia (oil, natural gas and oil (associated) gas, coal and, to a much lesser extent, peat and oil shale), and the products of their refinement. The energy sector is the source of the following greenhouse gases: carbon dioxide (CO2), methane (CH4), dinitrogen oxide (N2O) and ozone precursors (NOx, CO, non-methane volatile organic compounds (NMVOCs) and SO2). In the component composition of greenhouse gases CO 2 is dominating - its share in 2010 was 79.2% from all the emissions in the sector. The contributions of CH4 and N2O are 20.5% and 0.4% respectively. . According to the IPCC classification, the sector "Energy" provides the data on the emissions of greenhouse gases and indirect greenhouse gases from burning fuels (1.A), their leakage and evaporation (1.B), and also reference data on the use of fuels for international aviation and maritime transport and the combustion of biomass for energy purposes (1.C). Emissions from the fuels leakage and evaporation (fugitive emissions) include emissions from the extraction, storage, primary processing, transportation and consumption of oil, coal and gas, as well as emissions from fuels combustion in cases when the energy from the combustion is not used (eg, burning oil (associated) gas at the oil processing plants, process gases combustion of various industries, etc.). From 1990 to 1998 the total emissions from the energy sector decreased by 39.4% due to the economic factors that led to the reduction in the consumption of fossil fuels. The year 1998 saw the start of the economic growth which was accompanied by the increase of its energy efficiency. As a result, the consumption of fossil fuels in the country increased by a relatively low rate, and, accordingly, the greenhouse gas emissions in the energy sector increased by a low rate as well. In 2010, the total greenhouse gas emissions in CO2 equivalent amounted to 1.8 billion tons (1819 021.55 Gg CO2 Eq.) which is 33.0% below the 1990 levels. 2. Industrial Processes The inventory of greenhouse gas emissions from the sector "Industrial Processes" includes an assessment of emissions from mineral raw materials processing (2.A), the chemical industry (2.B), metallurgy (2.C), food and paper industry (2.D), production (2.E) and consumption (2.F) of halocarbons (HFCs, PFCs) and sulfur hexafluoride. The total greenhouse gas emissions in this sector in 2010 amounted to 172,810 Gg CO2-equivalents, which corresponds to 7.8% of total greenhouse gas emissions in the Russian Federation (excluding the sector Land Use, Land-Use Change and Forestry). From 1991 to 1998 there was a steady reduction in greenhouse gas emissions from "Industrial processes" associated with the decline in the industrial production in the Russian Federation. In 1998 the level of greenhouse gas emissions in the industry was minimal and corresponded to 52.1% of the 1990 level. Since 1999, the emissions in the industry gradually increased and peaked in 2007 (74.1% of the 1990 level). In 2008 - 2009 there was a reduction in greenhouse gas emissions, associated with a drop in production due to the global economic crisis, and to a lesser extent, with the reduction of specific emissions of greenhouse gases from such sources as the production of ammonia, a primary aluminum refrigerant HCFC-22, and sulfur hexafluoride. Greenhouse gas emissions in 2009 amounted to 61.4% of the level of industrial greenhouse gas emissions in 1990. In 2010, emissions in the industrial sector reached 67.1% of the 1990 level. The largest source of emissions in the industrial sector is steel industry. Its contribution to the total emission of greenhouse gases in the industry in 2010 was 53.6%. The next largest source is the mineral raw materials processing. Its share in the total emissions is 27.1%. The share of the chemical industry emissions is 12.6%. .
Fig. 4. The share of "Industrial processes" in the amount of greenhouse gases in 2010 3. Solvent and Other Product Use Solvent and other product use contributes little to the overall greenhouse gas emissions of the Russian Federation (0.03% in 2010), the only source of the direct greenhouse gases emissions in this sector is the use of N2O in industry, medicine and other fields of application (CRF sub-sector 3.D "Other"). In Russia, N2O is used in medicine as an inhalation anesthetic. In 1990-2010 N2O emissions in general changed slightly, showing a weak downward trend until 1997, and a tendency to increase in the period from 1997 to 2010. As to NMVOCs emissions, the assessments made are approximate and do not allow making conclusions about the trends in emissions over time 4. Agriculture In 2010, total greenhouse gas emissions from the agricultural sector of the Russian Federation amounted to 136,802 Gg CO2 Eq., which corresponds to 43.1% of the 1990 level (317 295 Gg CO2 Eq.). In 2010, the contribution of nitrous oxide (N2O) in the overall agricultural emissions was more than twice higher (67.9%) than the contribution of methane (CH4) - 32.1%. The most significant sources in the agricultural sector of the Russian Federation are direct nitrous oxide emissions from agricultural soils (51 474 Gg CO2 Eq.) and CH4 emissions from the enteric fermentation of domestic animals (38 296 Gg CO2 Eq.). In the years 1990-2010 the direct nitrous oxide emissions from agricultural land decreased by 49.6%, and methane emissions from the processes of the enteric fermentation of animals - by 61.1%. The decrease of greenhouse gas emissions is associated with the reduction in the number of livestock and poultry in the agriculture of the country, as well as lower acreage of agricultural lands and the lower usage of fertilizers, as a result of economic transformations of the agricultural sector and the economy as a whole. On average, the number of livestock and poultry decreased by 39.3% compared to the 1990 levels. The area of cultivated land in Russia from 1990 to 2010 decreased by 31.8% or 42.1 million hectares. The usage of mineral nitrogen fertilizer decreased by 71.6%, which corresponds to a decrease of nitrogen inputs into agricultural soils by 3.0 million tons 5. Land Use, Land-Use Change and Forestry (LULUCF) The dynamics of carbon dioxide emissions from land use is determined by the balance of carbon in arable lands. In 2010, CO2 emissions from arable land amounted to 96.9 million tons, which is much less than the 1990 level and is due to the reduction of arable land (Fig. 5). A relatively small contribution to greenhouse gas emissions is made by liming, drainage of organic soils and peat mining, which is shown in Figure 5 as "other sources." Managed forests and grasslands (meadows and pastures), including the lands converted from arable ones are a sink of CO2. Detailed estimates of greenhouse gases emissions and sinks are presented in the common reporting format (CRF).
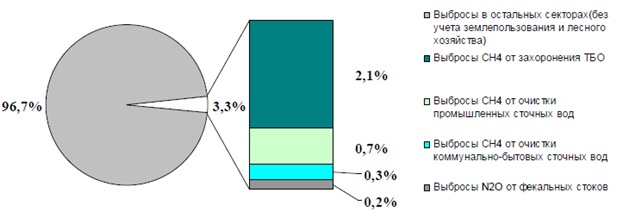
Fig. 5. Total greenhouse gas emissions in the forestry and land use (arable land and liming) 6. Waste Greenhouse gas emissions in the "Waste" sector include CH 4 emissions from managed and uncontrolled disposal of solid waste in landfills, emissions from the treatment of communal domestic and industrial waste waters and emissions of N2O from sewage effluent. The total greenhouse gas emissions in this sector in 2010 amounted to 72,687 Gg CO2 Eq. That accounts for 3.3% of total greenhouse gas emissions in the Russian Federation (excluding the sector Land Use, Land-Use Change and Forestry) and is 23.9% higher than in 1990 (Fig. 6). Starting from 1997, greenhouse gases emissions in the sector have increased. It is associated with an increase in the amount of municipal solid waste disposed of at landfills, as well as the increased production in food, paper and other industries, bringing about the growth of sewage treatment. In 2010, greenhouse gas emissions from the "Waste" sector decreased by 0.9% compared to 2009. The increase in greenhouse gas emissions from solid waste disposal sites in 2010, compared with 1990, amounted to 65.1%. This source contributes most to the total emission of greenhouse gases from the sector "Waste" (64.1% in 2010). Methane emissions from municipal wastewater treatment in 2010 were 16.7% lower than such emissions in 1990. Methane emissions from the industrial wastewater treatment in 2010 were 10.8% lower than the 1990 levels.
For this source category, from 1997 to 2009, there is quite a high rate of emissions growth. Its contribution to the total greenhouse gas emissions in the sector also increases (up to 21.2% in 2010). In 2010 there was an increase in methane emissions associated with industrial waste water treatment, the growth is 0.4% compared with the previous year. N2O emissions from sewage effluents in 2010 remained significantly (22.0%) less than the 1990 emissions, but there is an upward tendency related to the increase in the consumption of protein foods, continuing in 2010.
Fig. 6. The share of "Waste" sector in the amount of greenhouse gas emissions in 2010
Note 1. The inventory report is accompanied by the common reporting format tables (CRF tables), containing annual emissions data for specified sectors, sub-sectors and sources from 1990 to 2008. CRF tables from 15.04.2010 are available at the Secretariat of the UNFCCC. .
Note 3. One gigagram (Gg) is equal to one thousand tons. The information on the changes in anthropogenic greenhouse gases emissions of Annex I in the period 1990 – 2010. Using the national inventory reports of the Annex I countries, sent to the UNFCCC Secretariat in spring 2012, the following table presents the data on the country's commitments under the Kyoto Protocol, changes in anthropogenic greenhouse gases emissions from 1990 to 2009 and 2010 (the data on the amount of emissions are shown excluding Land Use, Land-Use Change and Forestry). |
Поиск по сайту
Newsletter posting
Guidelines of site
Weather forecast
Map of visitors
|
|
